When you click on links to various merchants on this site and make a purchase, this can result in this site earning a commission. Affiliate programs and affiliations include, but are not limited to, the eBay Partner Network.
I got a few requests for pricing on the GTR similar to my thread on GTS so here you go.
Depreciation Curve
Very high premium over the 2018 MY, almost 12% from 2018->2019 and 13% from 2019->2020
Unless you like something very specific to the 2019+ MY, it's best to stay with 2018 MY if you care about depreciation
Listing History
2019 MY has the fewest inventory followed by 2020 MY. 2018 MY has the most inventory.
8% depreciation in listing price over the last year for 2018 MY. The absolute minimum depreciation is around 3-5% so this isn't that much higher than that. While it'll continue to trend down, for a special model like the GTR, this is probably a safe bet at the moment.
6% depreciation for 2019 MY though due to lower inventory, it's hard to accurately tell whether this will increase rapidly once more cars hit the market.
2020 MY is depreciating a LOT so stay away if you care about depreciation.
Sold Cars History
Not much interesting going on here. Even though there's little inventory for 2019-2020 MY, the cars are staying on the market relatively long. It indicates that there aren't that many buyers for the GTR at that price range which indicates quite a lot of upcoming downward pressure in the next few months.
2018 MY sold cars look healthy. Higher mileage cars are selling fast at lower prices so buyers aren't as concerned about mileage on these cars.
Hope this helps the various folks that asked. Good luck on your hunt!
Interesting stuff. Couple of questions if you don't mind.
1. I am assuming your charts are in the order of '18, '19, '20?
2. Under Dep. Curve, what's sample size you have for 2019? And are these based on sold or listing prices?
3. Is the trend line is plotted through medians as well per your other thread?
4. Besides the usual places for transactional data (bat, manheim and the like), where else are you sourcing? It's ok if you don't want to reveal your source.
~2018 AMG GTR or R8 V10 Plus have to be the best values in the market right now for ~$130k.
Couldnt agree more. Being 6'4" the R8 is a no-go zone for me (I tried!)! The foot well is SO small and narrow combined with the roof line - Im a circus bear riding a tricycle.
Interesting stuff. Couple of questions if you don't mind.
1. I am assuming your charts are in the order of '18, '19, '20?
2. Under Dep. Curve, what's sample size you have for 2019? And are these based on sold or listing prices?
3. Is the trend line is plotted through medians as well per your other thread?
4. Besides the usual places for transactional data (bat, manheim and the like), where else are you sourcing? It's ok if you don't want to reveal your source.
Excellent summary. I have been collecting GTR & GTR Pro raw listing price data & price erosion as well, but not spent any time analyzing trends. I have the same questions as posted above and would really enjoy seeing your analysis on Pro versions although I recognize there's less data to work with. On a purely subjective basis, I don't see any variation in pricing associated with specific paint colors or options such as CCM brake packages - mostly down to model year and mileage as you pointed out.
As a data point, my ‘18 GTR with an MSRP of $194K sold retail for $131K.
Car was in excellent condition with almost new OEM tyres and had 6,000 miles on it. Also, it had a full body PPF installed that was still in good condition.
Interesting stuff. Couple of questions if you don't mind.
1. I am assuming your charts are in the order of '18, '19, '20?
2. Under Dep. Curve, what's sample size you have for 2019? And are these based on sold or listing prices?
3. Is the trend line is plotted through medians as well per your other thread?
4. Besides the usual places for transactional data (bat, manheim and the like), where else are you sourcing? It's ok if you don't want to reveal your source.
1. I wish there was a way to tag each image with a caption on here. But yes, they are in order 18, 19, 20.
2. Dep Curve charts are based on listing history. Reported selling price has a bit of noise to it (auctions, under reporting due to tax purposes, etc.) so I opt to use listing price for Dep Curve (you can basically discount 5-10% to get the selling price range). Sample size was 5 cars for 2019 MY.
3. Yes, all trend lines are median. I avoid average because there are always huge outliers, either because of some crazy sellers, price typos, etc.
4. Those are the usual places you listed. Without revealing too much I do get some rough data from DMV reported sales but I adjust for error rates of under reporting sale prices for tax purposes.
If anyone is interested in a specific car, I'm happy to look up the listing history for you, just PM me the VIN. A lot of dealers will delist cars that have sat around for awhile in order to reset the days on market so my report reveals that. It also shows the overall price reductions across multiple sites; it helps to see how willing a dealer is to negotiate.
Excellent summary. I have been collecting GTR & GTR Pro raw listing price data & price erosion as well, but not spent any time analyzing trends. I have the same questions as posted above and would really enjoy seeing your analysis on Pro versions although I recognize there's less data to work with. On a purely subjective basis, I don't see any variation in pricing associated with specific paint colors or options such as CCM brake packages - mostly down to model year and mileage as you pointed out.
Unfortunately most listing sites don't separate the R from the Pro so I can't really do it without digging through the VIN specification. But the trend analysis above should include Pro. These are the only three Pro cars I see on sale right now.
There may be a few more Pro models available (no background highlight appears to be active). Interestingly the Solarbeam Yellow at the top that I test drove has an interesting listing price history....
$194,001 at MB Scottsdale when I tested it.
$188,994 on 9/18/20 at Illuso, Costa Mesa
$178,994 at Illuso
$210,541 at Mike Ward Aston Martin, Denver https://www.astonmartindenver.com/in...j7ka9la028074/
or $211,330 at Mike Ward Maserati https://www.mikewardmaserati.com/inv...yj7ka9la028074
Talk about predatory pricing. The blue highlights are BAT auctions with the one at the bottom due to close in 3 days.
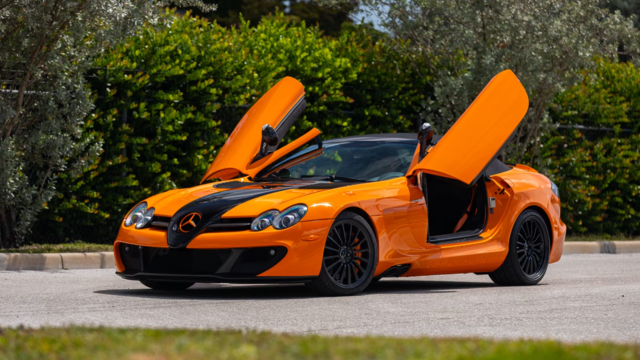
Mercedes SLR McLaren 722 S Is Extremely Rare Example Modified by McLaren
Slideshow: A one-of-one U.S.-spec Mercedes-Benz SLR McLaren Roadster became even rarer after a factory-backed transformation at McLaren's headquarters.