


Old Dyno Graph vs New Dyno Graph
Thread Starter
MBWorld Fanatic!
Joined: Jan 2009
Posts: 7,659
Likes: 67
From: Atlanta
2006 E55 AMG
Old Dyno Graph vs New Dyno Graph
Buckhead Imports Performance, nuff said
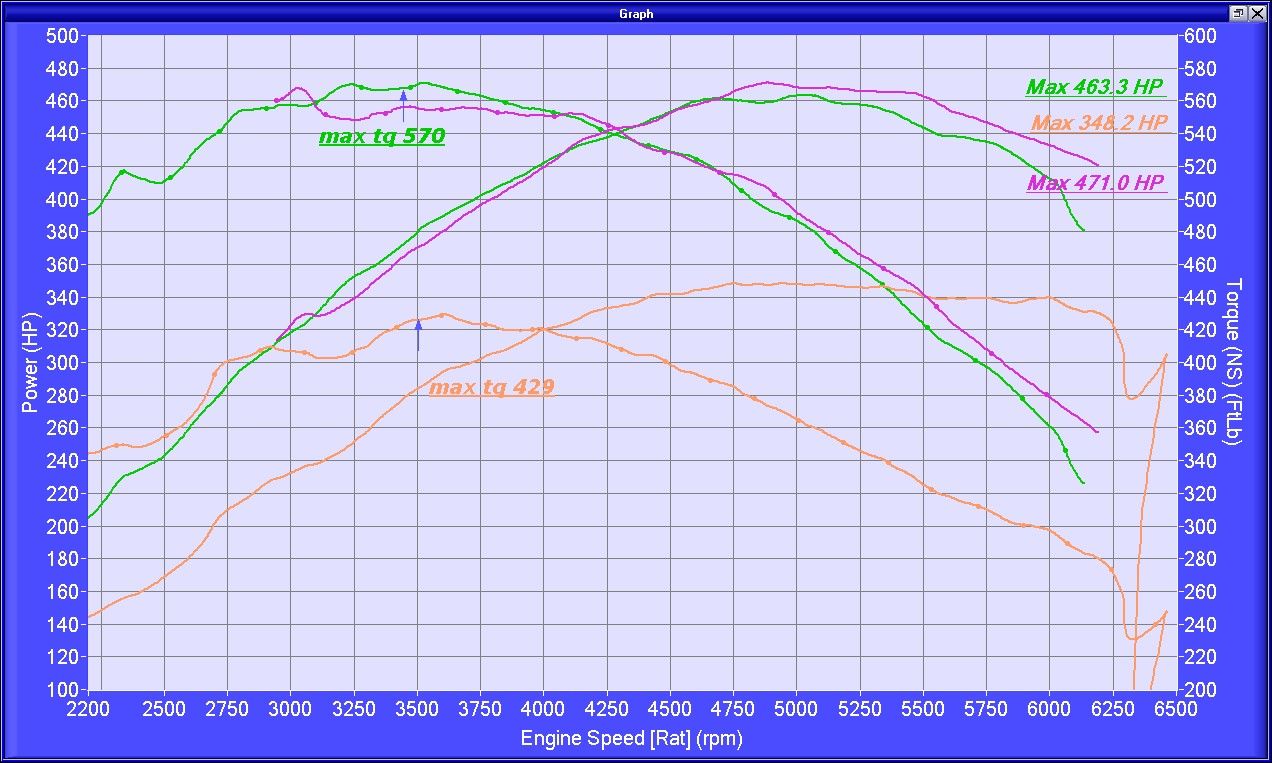
Dynamics Dyno-Old Graph
Peach lines are stock, Purple is stage 3
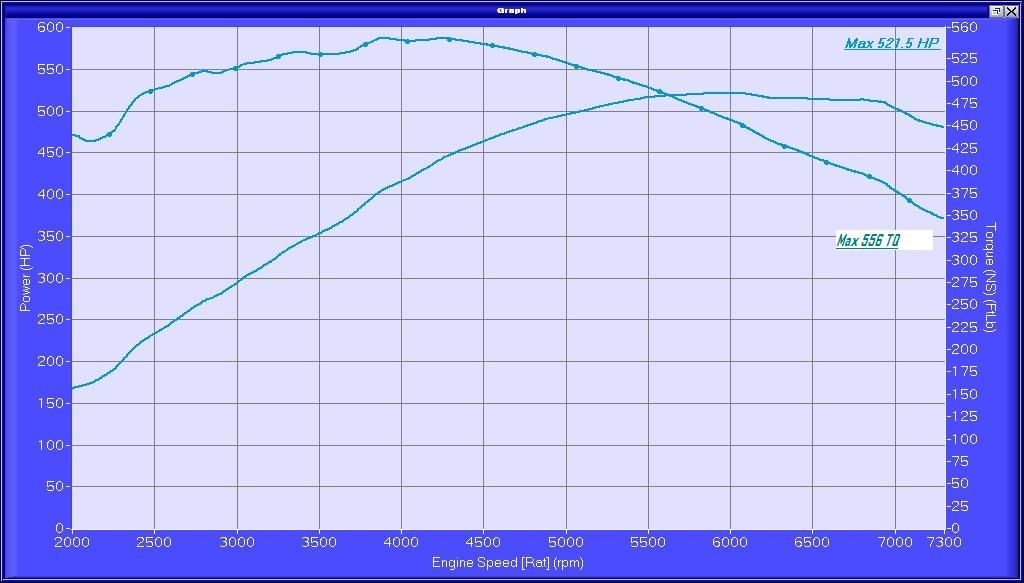
Dynamics Dyno-New Graph (inserted TQ number myself, as it did not print)
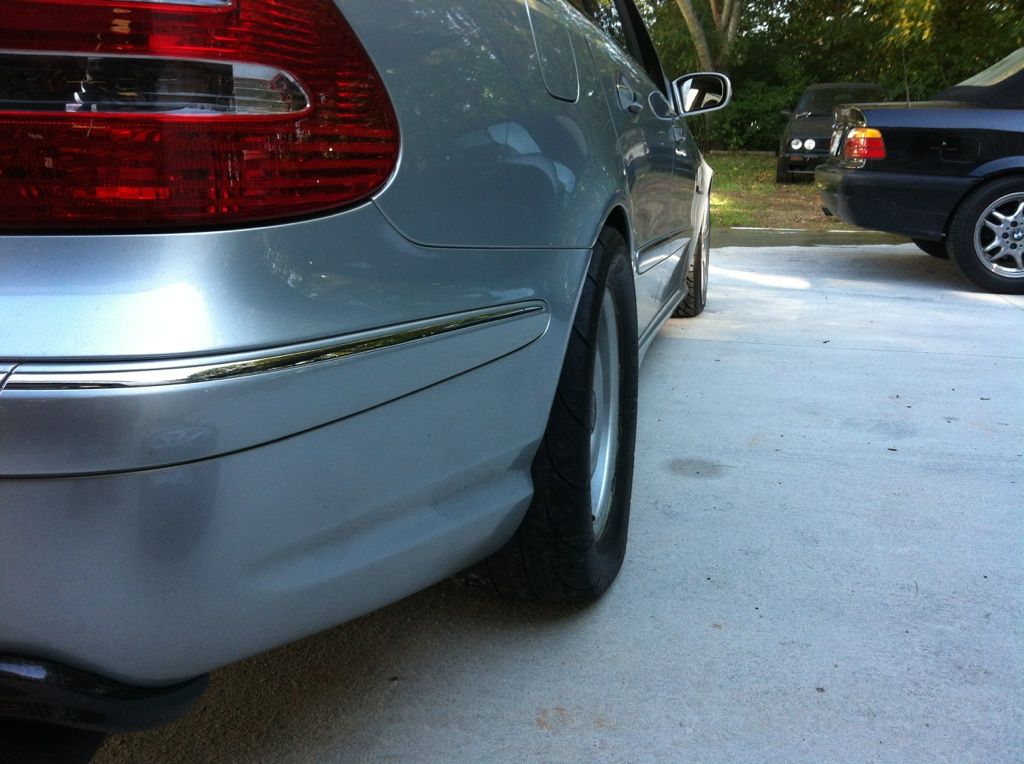
Drag setup is on:
Dynamics Dyno-Old Graph
Peach lines are stock, Purple is stage 3
Dynamics Dyno-New Graph (inserted TQ number myself, as it did not print)
Drag setup is on:
Last edited by chawkins2001; Oct 21, 2011 at 03:51 PM.
PLATINUM SPONSOR

Joined: Jun 2008
Posts: 3,834
Likes: 65
From: Texas
2003 CL55
Smooth lines ! Tony still working over there?
__________________

E63 Biturbo, UPD Cold Air induction kit, UPD performance crank pulley and UPD adjustable rear suspension with ride height adjustment.
CL55 UPD Cold Air Boost kit, UPD 3000 stall converter, UPD 77mm SC clutched pulley and beltwrap kit, Custom long tubes, UPD crank pulley , UPD suspension kit, UPD SC pulley, Aux. HE, Trunk tank w/rule 2000 pump, Mezeire pump, UPD 5pc idler set, Aluminum rotor hats.
www.ultimatepd.com
instagram @ultimate_pd
facebook.com/ultimatepd
Thread Starter
MBWorld Fanatic!
Joined: Jan 2009
Posts: 7,659
Likes: 67
From: Atlanta
2006 E55 AMG
Trending Topics
MB World Stories
The Best of Mercedes & AMG

Manual Mercedes? 6 Times Sindelfingen Let Drivers Have All The Fun
Verdad Gallardo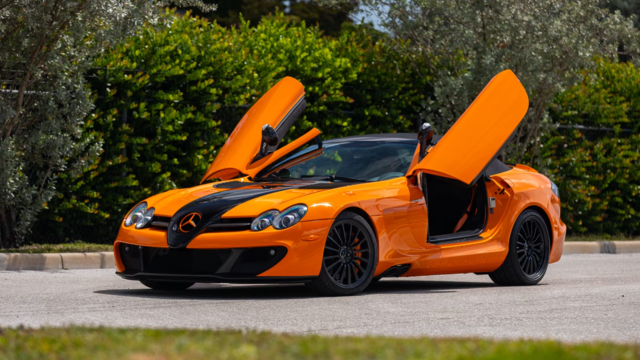
Mercedes SLR McLaren 722 S Is Extremely Rare Example Modified by McLaren
Verdad Gallardo
8 Classic Boxy Mercedes Designs That Have Aged Like Fine Wine
Verdad Gallardo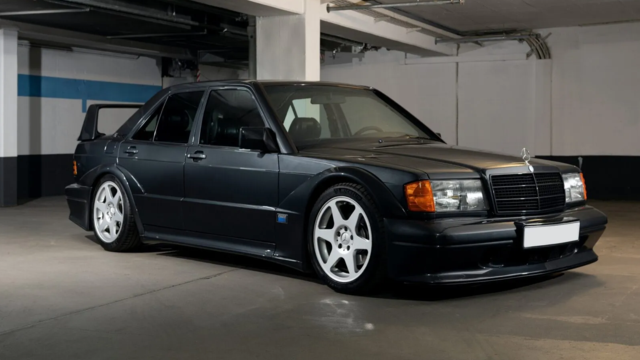
Flawlessly Restored Mercedes 190E Evo II Heads to Auction
Verdad Gallardo
Electric Mercedes C-Class Unveiled: 11 Things You Need to Know
Verdad Gallardo
Mercedes EQS Gets A Major Update: Everything You Need to Know
Verdad Gallardo
5 Underrated Mercedes-Benz Models That Don't Get the Love They Deserve
Verdad Gallardo
Mercedes 300D Has Pushed Well Past 1 Million Miles and It Ain't Stopping
Verdad Gallardo
10 Most Reliable Mercedes-Benz Models You Can Buy Used
Verdad GallardoSuper Member
Joined: Jan 2010
Posts: 692
Likes: 11
From: Murfreesboro, TN
SRT-6
Sick numbers, and those drag meats look RAUCUS!!! 
Has there been a date nailed down for Steele yet?
**EDIT**
Saw the other thread, NVM!
Has there been a date nailed down for Steele yet?
**EDIT**
Saw the other thread, NVM!
Last edited by Kreuzfeuer; Oct 21, 2011 at 05:22 PM.

MBWorld Fanatic!
Joined: Aug 2007
Posts: 2,596
Likes: 5
From: Jacksonville, FL
05 White Pano E55, Cadillac CTS-V
He just showed his new graph of 521 on a dyno dynamics so why whould you think the same exact number on dynojet?
So what was done to gain 50whp, just retuned or some other hardware added?
I need some more dang power, maybe I need a more aggresive tune, I am only making 509 on a dynojet with a boat load of mods.
So what was done to gain 50whp, just retuned or some other hardware added?
I need some more dang power, maybe I need a more aggresive tune, I am only making 509 on a dynojet with a boat load of mods.
Super Member
Joined: Mar 2011
Posts: 502
Likes: 0
From: Porter Ranch, CA
E55, CTS-V Wagon, Duc 1098R
Wow - Maybe I'm missing something but its going out to 7300 RPM? Never seen that before. Did they forget to calibrate your wheel speed to RPM with the drag setup?


MBWorld Fanatic!
Joined: Jun 2010
Posts: 4,173
Likes: 7
From: Puerto Rico
2005 E55 AMG
He just showed his new graph of 521 on a dyno dynamics so why whould you think the same exact number on dynojet?
So what was done to gain 50whp, just retuned or some other hardware added?
I need some more dang power, maybe I need a more aggresive tune, I am only making 509 on a dynojet with a boat load of mods.
So what was done to gain 50whp, just retuned or some other hardware added?
I need some more dang power, maybe I need a more aggresive tune, I am only making 509 on a dynojet with a boat load of mods.
Super Member
Joined: Mar 2011
Posts: 502
Likes: 0
From: Porter Ranch, CA
E55, CTS-V Wagon, Duc 1098R
Must be the new intercooler from this thread. Seems like it since the curves look like he got more boost with less heat soak i.e. The holy grail!
If so, get us that pricing chawkins since that is some good stuff !
!
https://mbworld.org/forums/w211-amg/...yno-sheet.html
If so, get us that pricing chawkins since that is some good stuff
!https://mbworld.org/forums/w211-amg/...yno-sheet.html
He just showed his new graph of 521 on a dyno dynamics so why whould you think the same exact number on dynojet?
So what was done to gain 50whp, just retuned or some other hardware added?
I need some more dang power, maybe I need a more aggresive tune, I am only making 509 on a dynojet with a boat load of mods.
So what was done to gain 50whp, just retuned or some other hardware added?
I need some more dang power, maybe I need a more aggresive tune, I am only making 509 on a dynojet with a boat load of mods.
MBWorld Fanatic!
Joined: Mar 2011
Posts: 1,835
Likes: 12
From: The Granite State
.
That first graph is completely bizarre.... In one pull the HP/TQ crosses over at 4000 rpm, and in the other two pulls on the same graph they cross over near 4250 RPM.
At first I thought it was due to the fact that there is a different y-axis scale on either side of the graph for HP & TQ... But I can't think of a reason why three pulls on a single graph can cross-over at different spots.

If these graphs were all plotted on a single chart (with only one y-axis range) I suspect the gains would appear to be even more dramatic than they look now.
-G
Thread Starter
MBWorld Fanatic!
Joined: Jan 2009
Posts: 7,659
Likes: 67
From: Atlanta
2006 E55 AMG
We got the GPro boyz and these were done in 1:1 gear ratio, 4th gear.
Listed below is the Dynojet numbers from today:
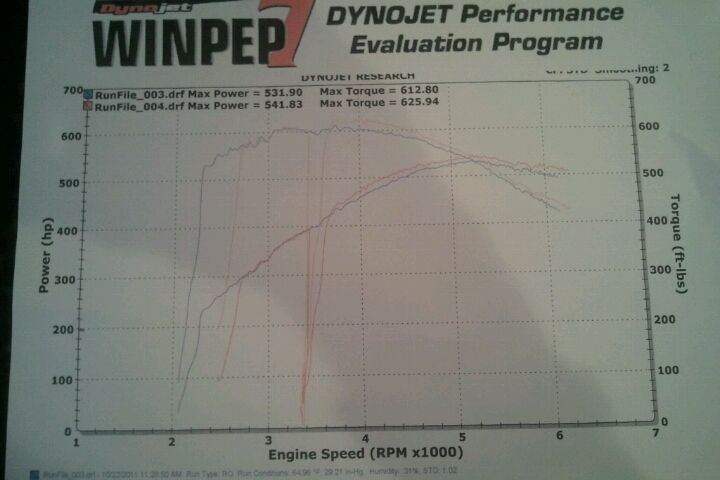
The drop in the graph relates to the car kicking down a gear and then back up to 4th.
Listed below is the Dynojet numbers from today:
The drop in the graph relates to the car kicking down a gear and then back up to 4th.
MBWorld Fanatic!
Joined: Aug 2007
Posts: 2,596
Likes: 5
From: Jacksonville, FL
05 White Pano E55, Cadillac CTS-V
Chawkins can you clarify what the difference was with the car from the original dyno dynamics graph in the thread of 471whp to the new dyno dynamics run of 521whp? A retune and changing out the intercooler is that what this was about? Or was there a big temperature difference from old to new graph? I am confused where the 50whp came from.


